
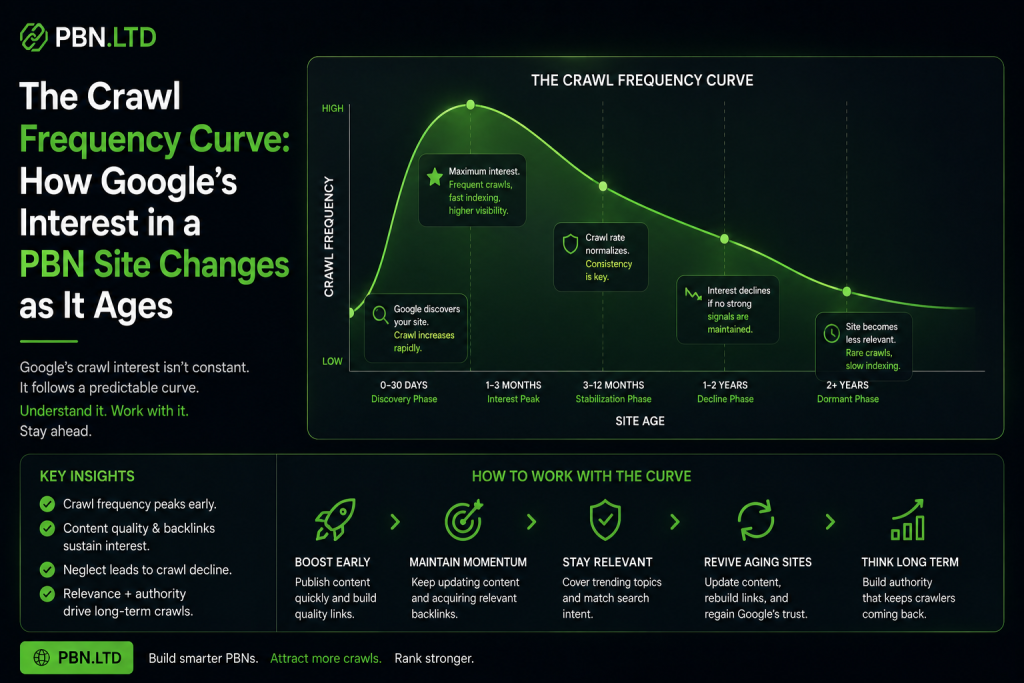
Most PBN operators think about crawl frequency as a binary — either Google is crawling a site or it isn’t. The reality is considerably more nuanced, and understanding it properly changes the way you time link deployment, manage content schedules, and maintain network sites over the long term. Crawl frequency isn’t a fixed property of a site. It’s a dynamic signal that changes continuously based on what Google’s systems have learned about the site over time — and it follows a predictable curve that experienced operators can work with rather than against.
The crawl frequency a PBN site achieves at six months of age is fundamentally different from what it achieves at launch, and different again from what it achieves at two years if it hasn’t been maintained properly. Understanding each phase of that curve — what drives it, what accelerates it, and what causes it to decline — is one of the most underappreciated factors in running a network that compounds in value rather than degrading quietly. how Google’s crawl behaviour has evolved across a decade of algorithm changes shows how each successive wave of algorithm development has made crawl behaviour a more precise indicator of content quality and site legitimacy, not less.
What Actually Determines How Often Google Crawls a Site
Google’s official crawl budget documentation defines crawl budget as the product of two separate variables: crawl rate limit and crawl demand. Understanding both is necessary for understanding the curve.
Crawl rate limit is the technical ceiling — the maximum number of requests Googlebot can make to a site’s server within a given timeframe without degrading its performance. Google’s systems automatically adjust this based on server response speed and error rates. A site that consistently responds to requests in under 200 milliseconds receives a higher crawl rate limit than one that responds in 800 milliseconds. A site that regularly returns 5xx errors gets its crawl rate throttled automatically. This component is almost entirely under the operator’s control through hosting infrastructure choices.
Crawl demand is the variable that’s more relevant to the long-term curve. It reflects how much Google’s systems actually want to crawl a specific site — how much value they assess as existing in its content, how frequently that content changes, how many authoritative external sources reference it, and what the engagement signals from real users look like. A site with high crawl demand and a high rate limit gets crawled frequently. A site with low crawl demand — regardless of how fast its server is — gets crawled infrequently, because Google doesn’t see compelling reason to visit it often.
Google published a March 2026 documentation update on crawling that confirmed explicitly what practitioners had long observed: frequent crawling is a positive signal of healthy content, not a neutral technical output. The document confirmed that consistent, gradually growing crawl frequency over time is precisely what their systems are designed to produce for sites they’ve assessed as providing genuine value. The inverse is equally true: declining crawl frequency is a leading indicator that Google’s assessment of a site is deteriorating.
Phase One: Discovery (Days 1 to 30)
A newly registered domain or a freshly deployed site starts with no crawl history whatsoever. Google has no model of what the site is, no history of its update frequency, no backlink signals pointing toward it, and no user engagement data to draw from. From Google’s resource allocation perspective, the site is unknown territory with uncertain value — and Google allocates crawl resources to unknown territory conservatively.
The initial discovery crawl for a new site can take anywhere from a few days to several weeks after deployment, depending on whether links from already-indexed sources point toward it and whether a sitemap has been submitted. After that first crawl, the recrawl schedule begins at a low frequency — typically once every one to three weeks for a new site with no meaningful signals. This is a mechanically low baseline driven by the absence of history rather than by any negative assessment.
The most important action in Phase One is ensuring discovery happens quickly and that the initial pages Googlebot encounters establish a coherent picture of the site’s topic area. getting new PBN sites indexed and crawled faster in 2026 covers the specific steps that accelerate this process — sitemap submission, internal linking from launch, server response optimisation, and the CDN configuration factors that determine how quickly Googlebot can process initial requests.
What Phase One is not: it is not a viable period for link deployment. A site crawled every two to three weeks, with no established authority signals and no crawl history, passes a fraction of the link equity it will eventually pass at maturity. Deploying links during this phase isn’t just premature — it’s also a footprint risk, since the timing pattern of link deployment relative to site launch is something Google’s spam detection systems monitor.
Phase Two: Assessment (Months 1 to 3)
As Googlebot accumulates crawl history on a site, the assessment phase begins. Google’s systems are building a model: what topics does this site cover, how consistently does it update, what quality level does its content meet, and how does it compare to other sites in the same topic space. The signals that drive crawl frequency upward during this phase are almost entirely content-related.
Each new article published on the site that Googlebot discovers creates a history data point: this site updates. If articles are published consistently — weekly, or at minimum bi-weekly — Google begins adjusting its recrawl schedule to account for the expected update frequency. A site that publishes once per week starts receiving crawl attention roughly once per week. A site that published its initial ten articles at launch and then stopped updating receives crawl attention consistent with a site that doesn’t change — which means crawl frequency plateaus at the discovery baseline and stays there.
The content quality dimension matters here more than in any subsequent phase. PBN content that builds genuine crawl demand over time in this assessment window establishes whether Google’s systems classify the site as a genuine resource worth tracking or as a site whose content doesn’t merit frequent index refreshes. Thin content, generic coverage of a topic without specificity, or articles that fail to demonstrate any real knowledge about their subject tend to produce stagnant crawl frequency even when published at consistent intervals. Google is not simply tracking whether pages are added — it’s tracking whether those pages are worth adding to the index.
By the end of month three, a well-managed site with consistent, quality content publication should be receiving crawl attention approximately once or twice per week. A poorly managed site with thin content or inconsistent publication may still be on a fortnightly or monthly crawl cycle. The gap between these two outcomes compounds significantly from this point forward.
Phase Three: Trust Building (Months 3 to 6)
Phase Three is where crawl frequency begins to reflect something more than just update history. Sites that have built a coherent topical identity, maintained content quality, and begun to accumulate backlinks — including from within the network and ideally from some external sources — start to receive crawl attention at a frequency that reflects genuine authority signals rather than just content freshness.
The backlink dimension is significant in this phase. Google’s official documentation confirms that URLs receiving links from authoritative external sources are perceived as more important and therefore crawled more frequently. A network site that has received its first set of links from other sites — other network properties pointing toward it, and ideally a handful of genuine external links from real sites in the niche — has moved from being assessed solely on its own content to being assessed in the context of how other sites relate to it.
This is the phase where topical authority signals that increase Google’s crawl demand for a site built within individual PBN sites starts paying dividends in crawl terms. A site that Google has clearly identified as covering a specific topic area in genuine depth — because its content is consistently specific, detailed, and demonstrates real knowledge — receives more crawl attention than a generalist site of equivalent age. Google’s demand for a site’s content is partly driven by how clearly it occupies a distinct and useful position in its topic area.
From a link deployment perspective, Phase Three is when the first meaningful equity begins flowing reliably. The site is being crawled regularly enough that new or updated links are discovered within days of placement, and the authority signals are sufficient for the passing of equity to register in ranking systems. Operators who time their initial link deployment to this phase — rather than rushing it into Phase One or Two — consistently see better results from their network investments.
Phase Four: Peak Crawl Frequency (Months 6 to 18+)
A site that has been managed properly through the first three phases reaches a peak crawl frequency plateau that can range from daily to several times per week, depending on the combination of content freshness, authority signals, and server performance. At this stage, links placed on the site are typically discovered and processed within one to three days of publication — a meaningful improvement over the days-to-weeks lag of Phase One.
The characteristics of a site operating at peak crawl frequency are consistent: a clear topic identity established over hundreds of published pages, a backlink profile that includes both network links and some external references, a server infrastructure that responds to Googlebot requests quickly and reliably, and a content publication schedule that Googlebot has learned to anticipate. This last factor — the establishment of a crawl expectation — is more significant than it might appear. Google’s systems model update frequency patterns and schedule revisit cycles accordingly. A site that publishes every Tuesday creates an expectation that something new will be found on Wednesday. Breaking that pattern consistently sends a signal that the site has become less active.
The hosting infrastructure role becomes more visible at peak frequency. CDN-backed PBN hosting ensures server response times that allow Googlebot to complete crawl sessions efficiently, distributing sites across multiple CDN endpoints so that crawl requests are handled quickly regardless of Googlebot’s entry point. A site on slow shared hosting that takes 800ms to respond to every request is receiving fewer pages crawled per session than an equivalent site with sub-200ms response times — which means even with identical content quality and update frequency, the crawl ceiling is lower.
Sites that reach Phase Four and remain there are the most valuable components of any PBN network. They pass link equity reliably and quickly, they provide Googlebot with a consistent positive experience, and they accumulate additional authority over time as their crawl history grows. PBN sites that develop their own organic traffic and crawl footprint operate at this level — their crawl frequency reflects not just the hosting operator’s maintenance but the genuine signal value Google has assessed in their content over time.
The Decline Curve: What Happens When Maintenance Stops
Understanding the crawl frequency curve requires understanding its reverse. Sites that stop being maintained — where content publication halts, where links stop being updated, and where server response times degrade — experience a crawl frequency decline that mirrors the ascent but is often faster.
Google’s systems interpret the absence of updates as a signal that the site’s content isn’t changing. A site that published weekly for a year and then stopped publishing receives progressively less frequent crawl visits as Google’s model of its update frequency adjusts to the new reality. After three to four months of no updates, a previously well-crawled site may be back to fortnightly crawl cycles. After six to nine months of complete inactivity, it may be on a monthly or less frequent schedule.
This decline has direct consequences for link equity delivery. A site being crawled monthly will take weeks to reflect link changes, newly placed links may not be processed for an extended period, and the authority signals associated with active sites gradually decay. The practical implication is that network maintenance isn’t optional for operators who want consistent equity delivery — it’s the mechanism by which crawl frequency is maintained at the level that makes the network effective.
The decline curve also interacts with how Google assesses the site for quality purposes. A site whose crawl frequency is declining because it hasn’t been updated is being assessed, by implication, as a site whose content is becoming stale. This doesn’t produce deindexation on its own, but it erodes the trust and demand signals that drove the high crawl frequency in the first place.
Accelerating the Curve: What Actually Works
Operators who understand the crawl frequency curve can actively manage their network sites to ascend it more quickly and maintain peak frequency more consistently. Several interventions have clear, documented effects.
Server Infrastructure
The crawl rate limit component responds directly to server performance. A fast, stable server allows more Googlebot requests per crawl session, meaning more pages are discovered and processed in each visit. The difference between a site hosted on slow shared infrastructure and one on well-configured CDN infrastructure can be the difference between Googlebot crawling 15 pages per session and 80 pages per session — which affects how quickly new content is discovered and how promptly link changes are registered.
Consistent, Substantive Content Publication
Nothing drives crawl demand more reliably than a track record of publishing content that Google assesses as worth indexing. The key word is ‘substantive’ — thin content or AI-generated articles without editorial depth don’t generate the quality signals that build crawl demand, even if they register as new pages. how Google sees a rebuilt PBN site that increases Google’s assessment of the site’s value is what creates the crawl demand component that matters for long-term frequency.
Strong Internal Linking Architecture
Pages without internal links pointing to them are not reliably discovered by Googlebot even when a sitemap exists. A clear internal linking structure — where new articles are linked from existing high-crawl-frequency pages within the site — ensures that Googlebot’s visits consistently discover new content rather than only recrawling pages it already knows about.
Sitemap Freshness
Keeping the XML sitemap updated with accurate lastmod dates when content genuinely changes signals to Googlebot that specific pages are worth revisiting. This should be accurate — inflated or falsely updated lastmod dates are something Google’s systems detect and disregard. Accurate sitemap management is a lever; dishonest sitemap management wastes crawl budget.
Crawl Frequency as a Link Deployment Signal
The practical implication of the crawl frequency curve for PBN network management is that crawl frequency is a useful proxy for when to deploy links from a given site. A site being crawled daily or multiple times per week is processing link changes quickly and passing equity reliably. A site being crawled fortnightly is a weaker link source — not because its domain authority is lower, but because the equity it passes takes longer to be recognised and is less responsive to the changes operators make. Checking the Crawl Stats report in Google Search Console for each network site (where the property is connected) gives the most direct read on where each site sits on its frequency curve. natural link velocity patterns across a network across the network — timing link deployment to the crawl frequency of the source site — produces more consistent results than deploying links on a fixed calendar basis regardless of each site’s crawl status.
Understanding how SpamBrain evaluates link patterns from newly established domains also shapes how the crawl frequency curve interacts with link deployment timing — a site in early Phase One deploying links creates a pattern that spam classifiers are specifically trained to identify. Respecting the curve isn’t just about link equity quality; it’s about the pattern of link deployment looking natural against the backdrop of how Google assesses newly established domains.
For operators building new network sites from scratch and wanting to accelerate the crawl curve from day one, PBN site builds optimised for fast crawl establishment from launch handles the technical configuration — server infrastructure, CDN setup, internal linking architecture — that gives each site the best possible start on its crawl frequency trajectory. free personalised PBN advice is available for anyone assessing where specific sites in their existing network currently sit on the curve and what maintenance they need to maintain or recover peak frequency.